Our next step on our Sabermetric journey takes us through wOBA. It is simultaneously one of the most and least well known advanced stats in the sport of baseball. Most people who are big fans of baseball have probably at least heard of wOBA or its child stat, wRC+, but what actually is it? I’m not going to waste any time here, I’ll just show you its formula for the year 2025:
Equation 1, wOBA Formula
Now that you’ve seen the formula, your question is probably, “where did all those numbers come from?” With OBP, SLG, and other stats, it’s very clear. They all come from things we can see: the number of times someone gets on base or the number of bases they get on their hits. But these numbers seem to sort of materialize out of thin air.
On a side note, if your other question is “what is uBB”, the answer is unintentional walks. wOBA does not give credit to the hitter for intentional walks, as those are more often made on strategy calls than being from the merit of the hitter. And even when it’s due to the hitter being good, no hitter is good enough to induce an IBB without other circumstances that are related to the skill of their teammates (runners on base, late innings, etc). So, intentional walks aren’t attributed to the hitter (though, they are not penalized for an intentional walk either, as it is subtracted from the denominator)
Optional but interesting thoughts on the philosophies of Sabermetrics
The decision on IBBs is a decision made by the people who calculate wOBA at Fangraphs. It is a also a decision with which you can and may disagree. You can recalculate wOBA with intentional walks included if you would like, and that is the beauty of Sabermetrics, as you will learn more and more later on (especially with WAR). Tom Tango and the other minds behind these statistics merely provide a framework which they believe, in theory, can be ideal to calculate a player’s value. You can adjust the implementation however you would like. For example, I once calculated wOBA in a way which took into account the different base-out states that a hitter came to bat in, based on an article by Tom Tango. This form of wOBA can be seen as giving credit to a hitter for good strategy (for example, working a walk is not always equally valuable—if a base is open, it is less valuable) while also not giving them too much credit for being up to bat in high leverage situations (all of the wOBA weights are divided by leverage index in this situation, which essentially neutralizes any advantage of, for example, hitting with the bases loaded vs bases empty in this formula). It doesn’t give an advantage to a hitter for having good teammates, but it gives them credit for changing their approach at the plate depending on the base-out state.
I am, of course, getting ahead of myself. That last bit especially about leverage index won’t make much sense right now, but it will when I explain it later on in 201 Advanced Value Stats.
Calculating Linear Weights
Anyways, where does this formula come from? The answer is quite simple: run expectancy. If you’ve read my previous article on run expectancy, you’ll know how run expectancy is calculated: you count all the runs scored during plays with a certain base-out state and then after it in the inning, then you take the average of that count, and that’s the number of runs you’d expect to score from a base-out state. As it turns out, you can use this to calculate the value of a hitter. Of course, we don’t want to give the hitter credit for the base-out state they come to bat in—is it fair that a hitter who hits a grand slam gets more credit for their hit than one which hits a solo home run?—so we need to find a way to remove context from this situation.
This is a challenge which perplexed me when I was first learning about wOBA years ago. After a single, there are so many possible base-out states, how can you possibly account for them all? As it turns out, the answer is equally as simple as calculating run expectancy. What you do to calculate the value of a single is you calculate the (change in run expectancy from before the play to after the play, or the value of the play in run expectancy) for every single which has occurred in your set of plays. Then, you divide it by the number of singles, to get the average expected value of a single above average. You can then repeat this for all plays you need values for (uBB, HBP, 1B, 2B, 3B, HR, any out).
It is important to note the “above average” part of that definition, as this becomes important later. Let’s look at an individual play, for instance. With bases empty, 0 outs, the run expectancy is 0.481 runs. That means that the average team would score 0.481 runs on average in that situation. When a single is hit, that changes the base-out state to 0 outs, runner on first, which has a run expectancy of 0.859 runs. That means that the action of the hitter who hit the single has increased the run expectancy by 0.378 runs above the average run expectancy going into the PA. An average team would score 0.481 runs, but the hitter has now been responsible for increasing that by 0.378 runs, which means they have created 0.378 runs above the average.
If, for any reason, you’ve been following along to this point, calculating wOBA for yourself, you will still notice something: all these numbers seem quite… small. The weight for uBB which you have so far is likely somewhere around 0.29. Do not fret, you have not made a mistake, you are just missing two final steps.
The powers that be (Tom Tango, in his famous “The Book”, written with Michael Lichtman and Andrew Dolphin) decided that wOBA needed to be a stat which was easily understandable. So, they decided to put it on a familiar scale: that of OBP. So, it is defined that the average wOBA is equal to the average OBP.
This moves us on to the second to last step in calculating those fancy numbers in the wOBA equation. In OBP, the value of an out is defined to be zero. So, in wOBA, the same is true. What you do when you calculate wOBA is you normalize it, to make the value of an out to be zero. If, for instance, the value of a single were calculated to be 0.4 runs while the value of an out was calculated to be -0.2 runs, you would subtract the value of an out from the value of a single to get 0.6 runs above the value of an out.
Finally, you calculate the league average wOBA. This is simply done by calculating the wOBA of the whole league in the sample of plays you’re calculating the linear weights for. You take every single unintentional walk in baseball and multiply it by the constant you have, then every single HBP, and so on, until you get a number. This number will be too small (for 2025, you should get something in the ballpark of .250—I’m not calculating this but making an educated guesstimate). So, you divide to get a value called wOBA scale. Finally, the formula is achieved. When you multiply each weight in the wOBA formula by that wOBA scale, the wOBA scale has now been normalized so the league average wOBA is equal to the league average OBP.
What I have described is the calculation of linear weights. These quantify the impact of certain events on the run expectancy of a team, which can be used in many versatile ways. You can use them to isolate the individual offensive output of a player. You can use them to see whether a team may or may not be getting a bit lucky with the sequencing of their hits—if their cumulative team wOBA suggests they should be scoring fewer runs than they are, then maybe they’re slightly lucky. Linear weights are the foundation of modern baseball Sabermetric hitting stats.
So, to calculate wOBA, you multiply the number of outcomes of a certain type by its corresponding weight (and you can include more outcomes if you want! The formula I provided is merely the one which Fangraphs uses, you could add the number of times a batter reaches on error, or even wild pitches during their at bats if you were so daring—I wouldn’t agree with that latter decision on wild pitches, but you could do it if you wanted) and then divide it by the number of PAs minus the number of IBBs (to avoid penalizing the hitter for intentional walks).
Analyzing Linear Weights
Using linear weights, we can figure out that OBP is actually more important than OPS in modeling run scoring. Tom Tango does a more in-depth analysis using Markov Chains (where he finds that OBP is 1.9x as valuable as SLG) but, very basically, we can see that the value gained from getting a single is more than half the value earned from getting a double—there are diminishing returns beyond a single. SLG does not reflect these diminishing returns, giving a player double the value for a double, three times for a triple, etc when, in reality, the value of the first base reached is far more than the value of any other base. Hence, OBP is a more important stat for describing run-scoring, which is something we can see from these linear weights, making it a more “valuable” skill per point of OBP.
wOBA Analysis and Comparison to OPS
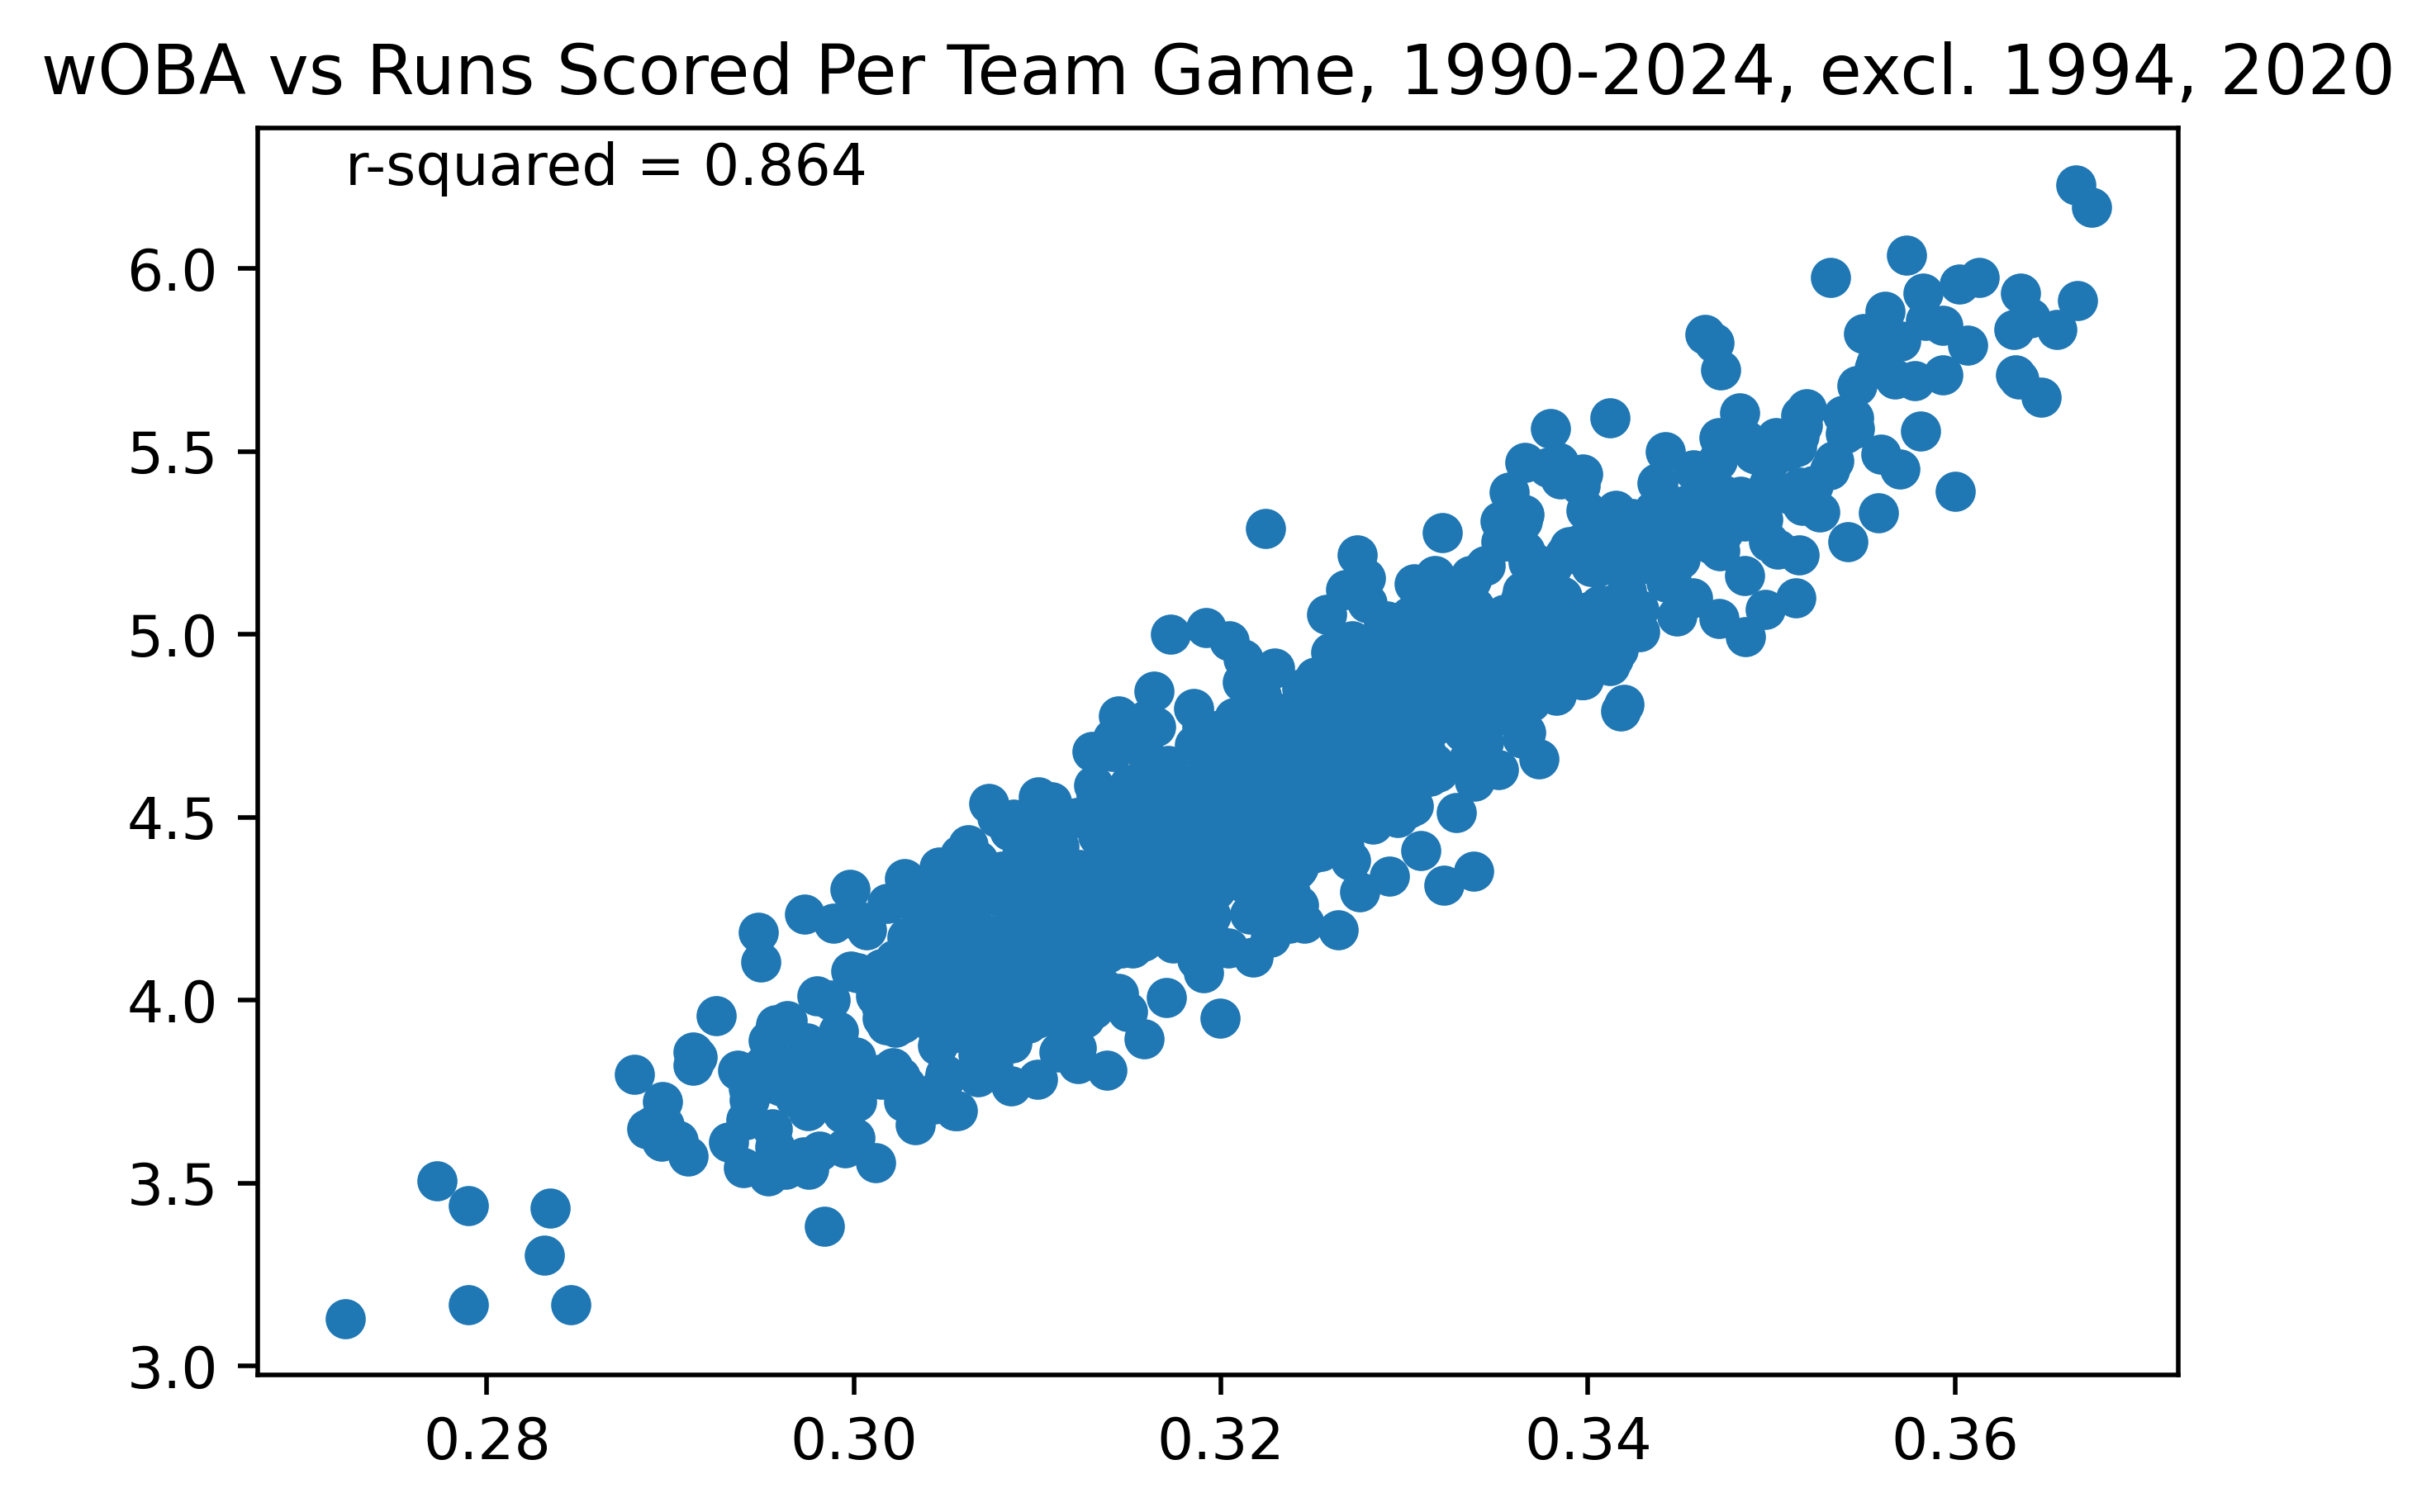 Figure 1. Team wOBA vs Runs Scored, 1990-2024, excl. 1994, 2020
Before I show the second important chart (the percentiles table), I have to add a note here and do some important analysis. Figure 1 shows wOBA has an r2 that is lower than that of OPS when compared to team runs per game. Why is this? It’s because wOBA isn’t strictly designed to be a team stat. Its goal is not to approximate team runs scored—what’s the point of that, we have individual runs. Its goal is to approximate the impact of an individual player on their team. Which is why it excludes things like sacrifice flies and intentional walks—players simply don’t have much control over that. But they’re still things that happen (and which teams as a monolithic unit along with their manager have control over, but not the individual players), so naturally wOBA will be very slightly less predictive against team runs scored (and keep in mind how slight this is, it’s still miles better than OBP or AVG).
Additionally, where wOBA overtakes OPS is in terms of being predictive. What does it mean to be a predictive? It means whether a stat can be used to predict future outcomes. If I know the 2025 wOBA of a team through the first month, can I predict their outcomes for the rest of the year? Let’s compare wOBA and OPS in this regard by comparing a team’s wOBA in one year to their runs scored per team game in the next year.
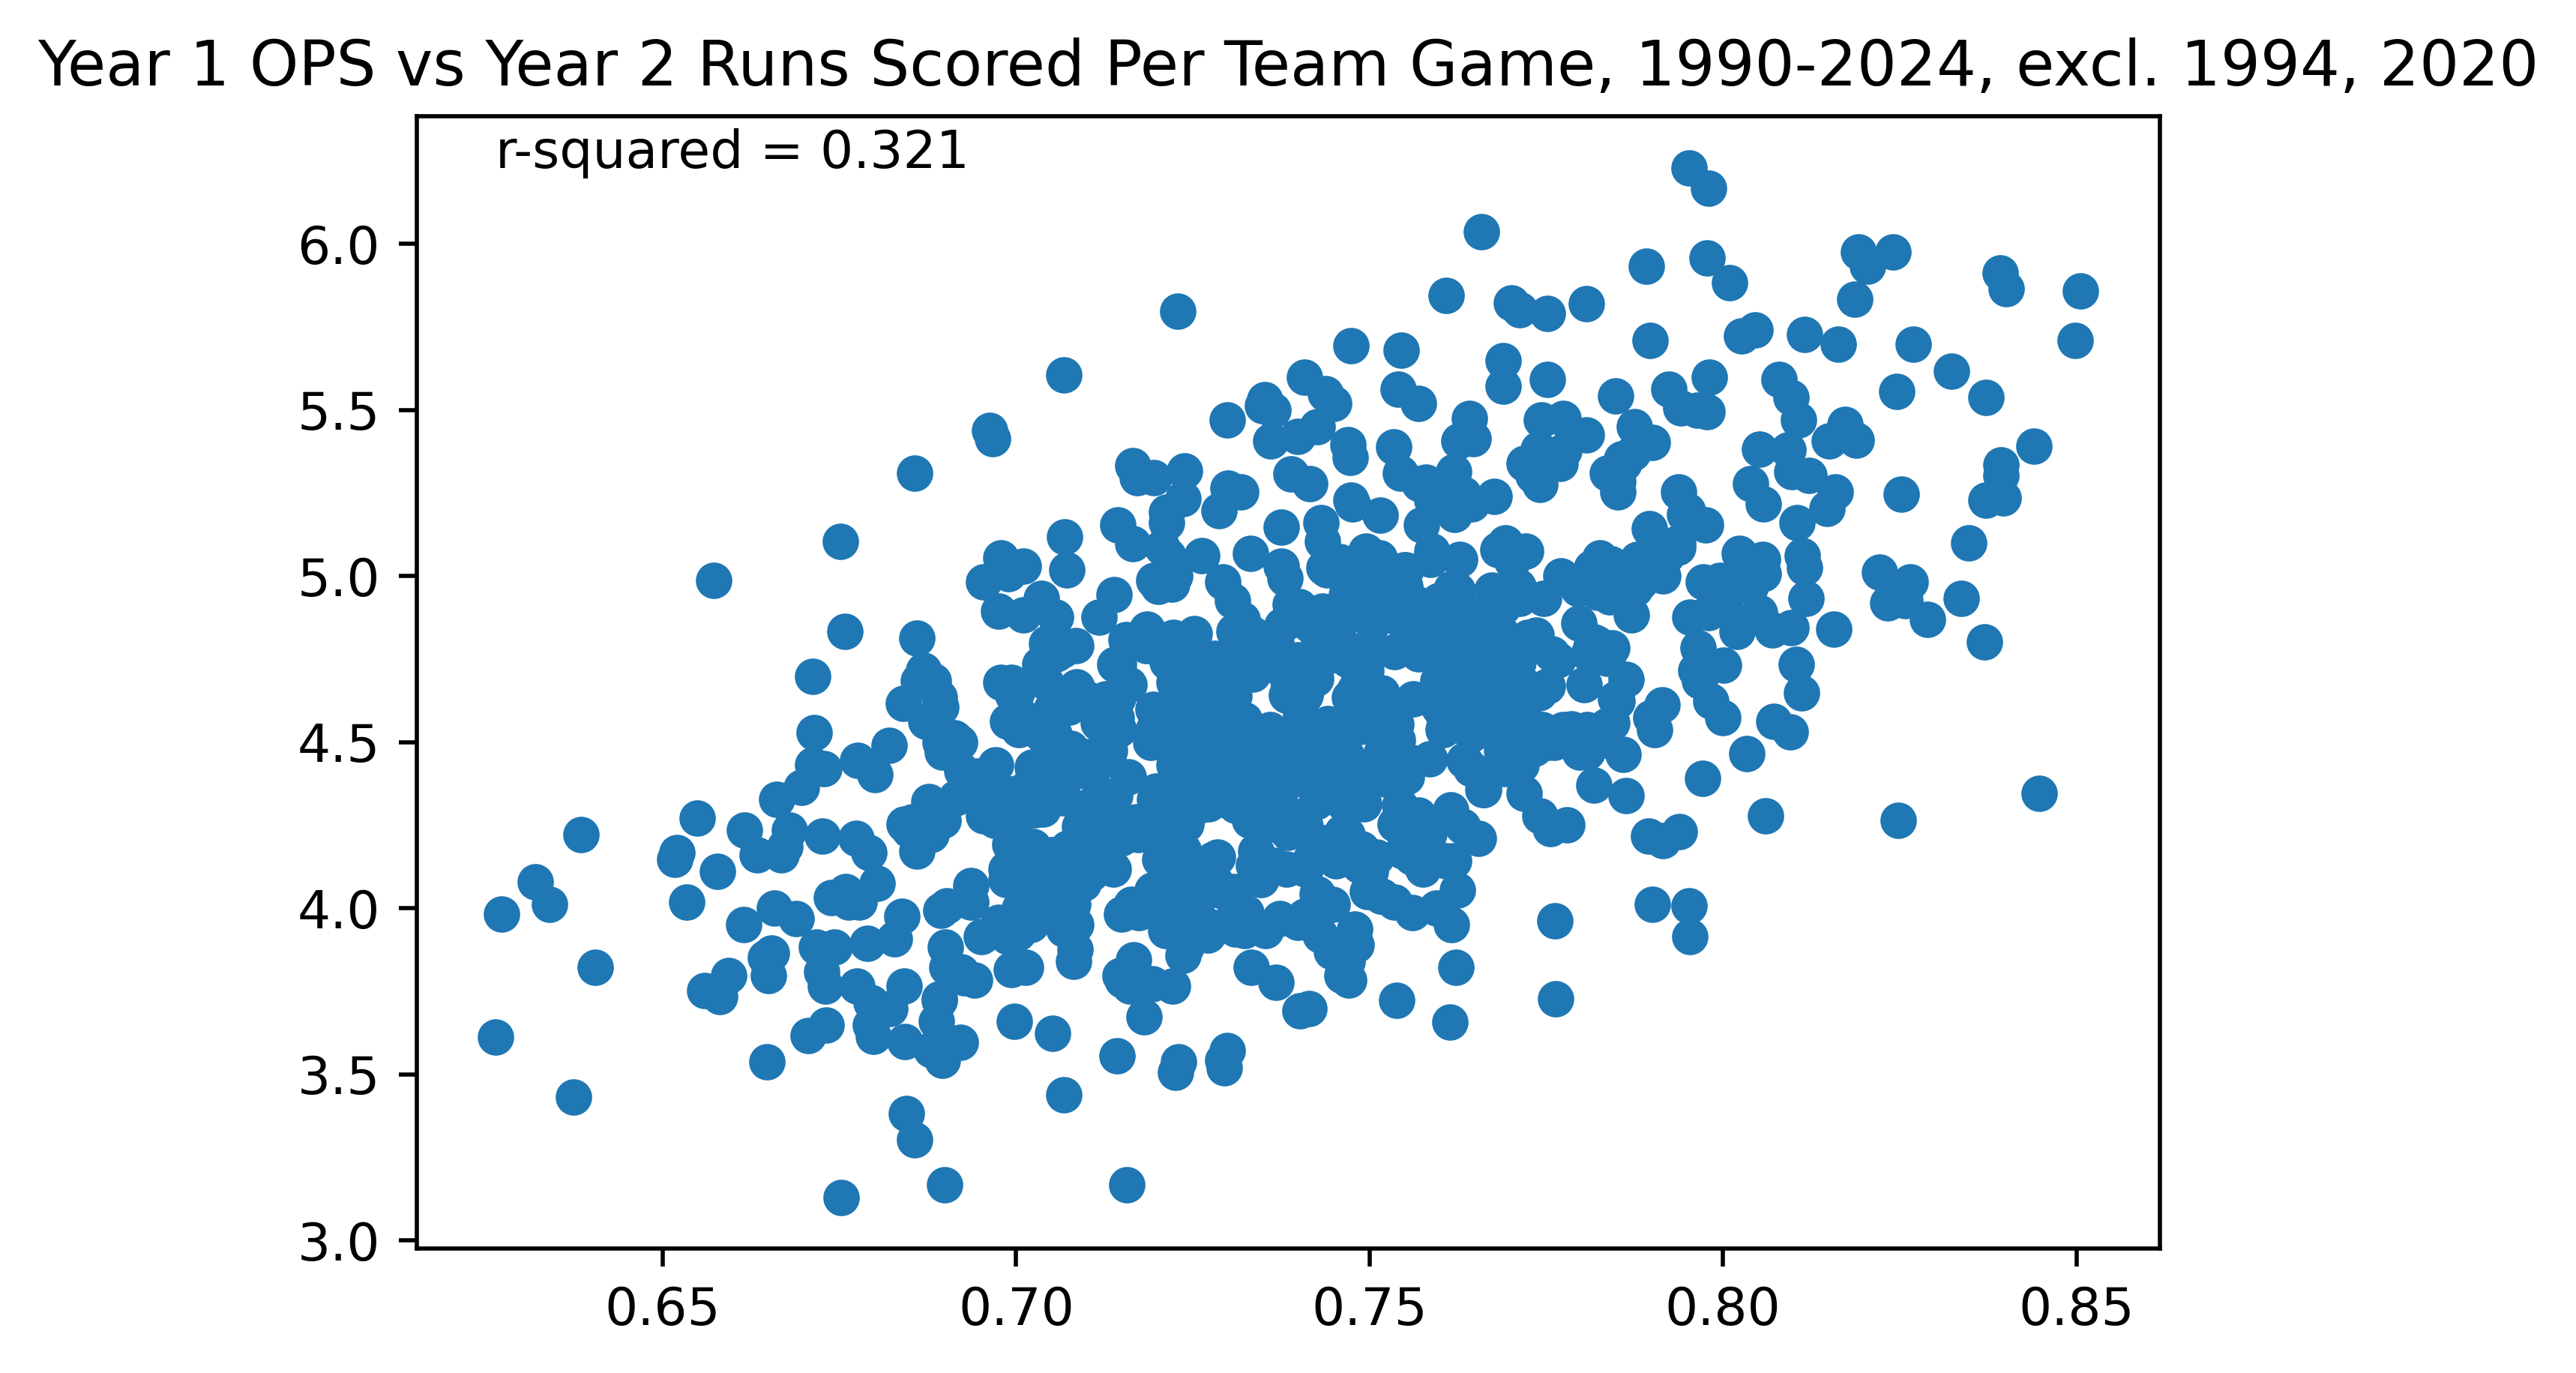 Figure 2. Predictiveness of Team OPS vs Runs Scored, 1990-2024, excl. 1994, 2020
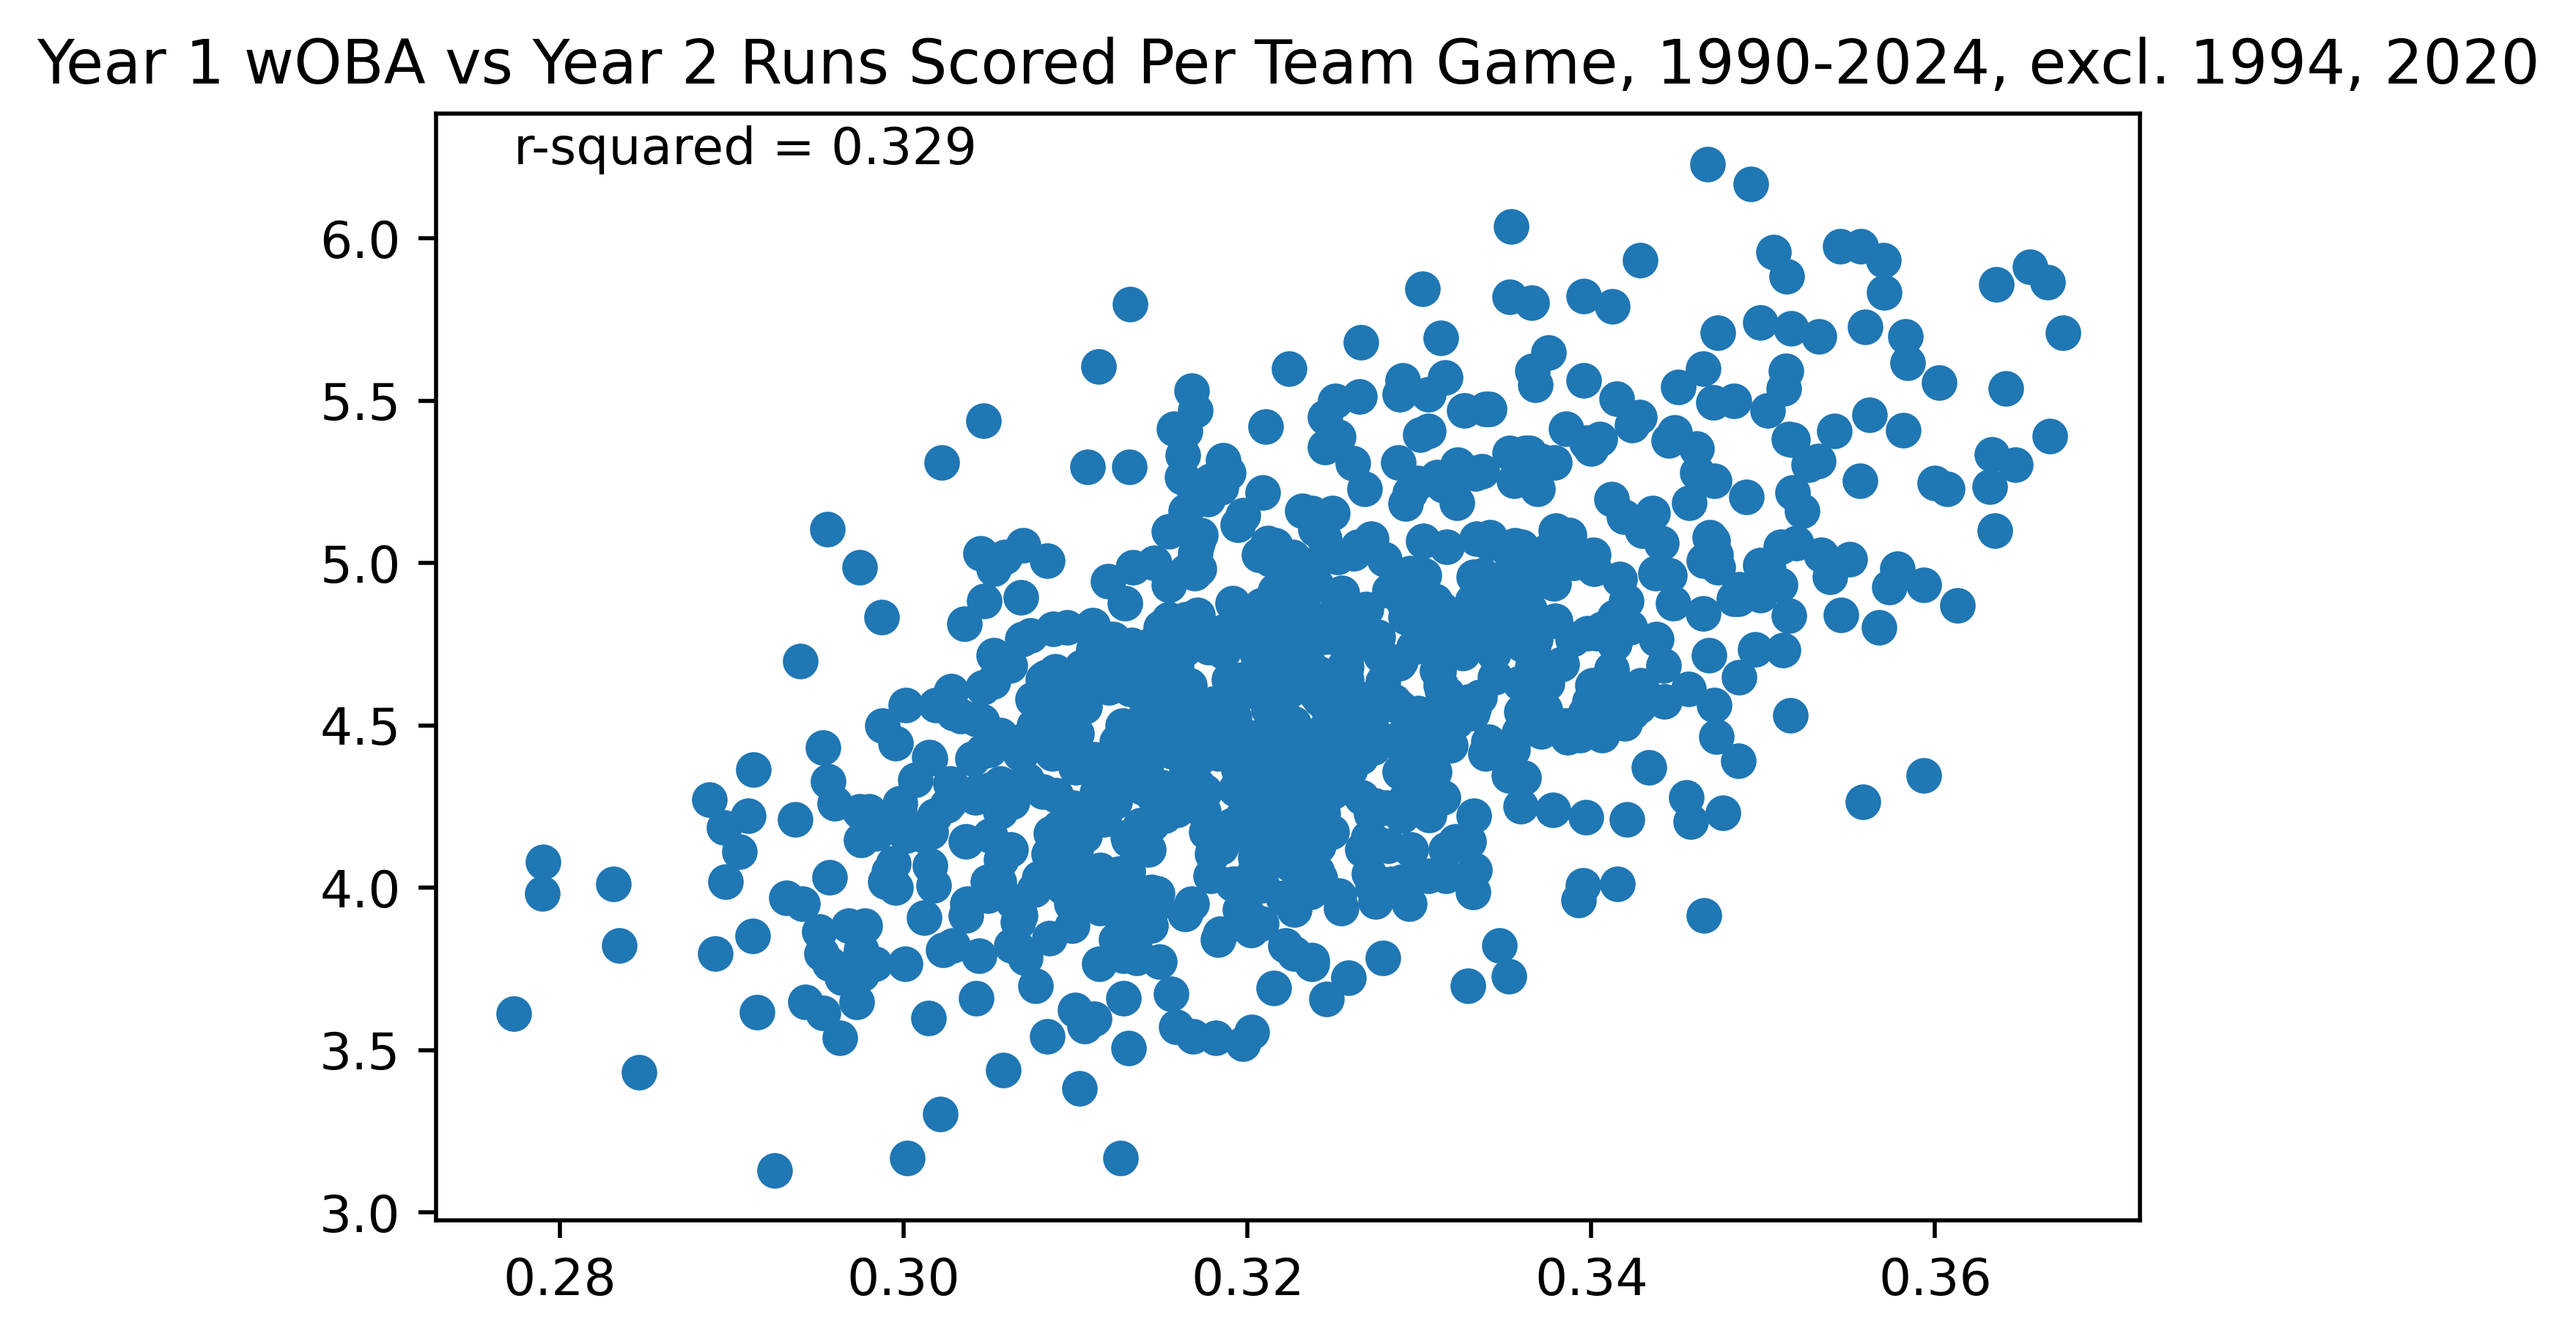 Figure 3. Predictiveness of Team wOBA vs Runs Scored, 1990-2024, excl. 1994, 2020
From Figures 2 and 3, you can see that wOBA is very slightly more predictive of future offensive output than OPS. Keep in mind that this is very slight—the difference is not necessarily significant. But what this definitively tells us is that wOBA’s primary strength is in measuring something called “True Talent”. If we assume that a baseball player has a talent—let’s say they’re a .300 hitter—that doesn’t mean they’ll play to this talent every year or every game. We’ll get to some of the actual causes in 301 Statcast section of this series, but a player may get lucky or unlucky. Two of the main ways this happens is through batted ball luck (hitting the ball well but it gets caught, or hitting it poorly but it’s a hit) or sequencing luck (if you just so happen to get more positive rolls of the dice with runners on base). This sequencing is part of why stats like runs scored aren’t predictive. When we are talking about prediction, we are actually trying to measure the True Talent of a player or team (until we get into quite advanced projection systems, it’s not possible to predict how True Talent will change year-over-year). And wOBA disregards some outcomes which are viewed as not reflecting True Talent (such as intentional walks and sacrifice flies), which leads to it being disproportionately better at measuring true talent. This can also be seen through its predictiveness of itself.
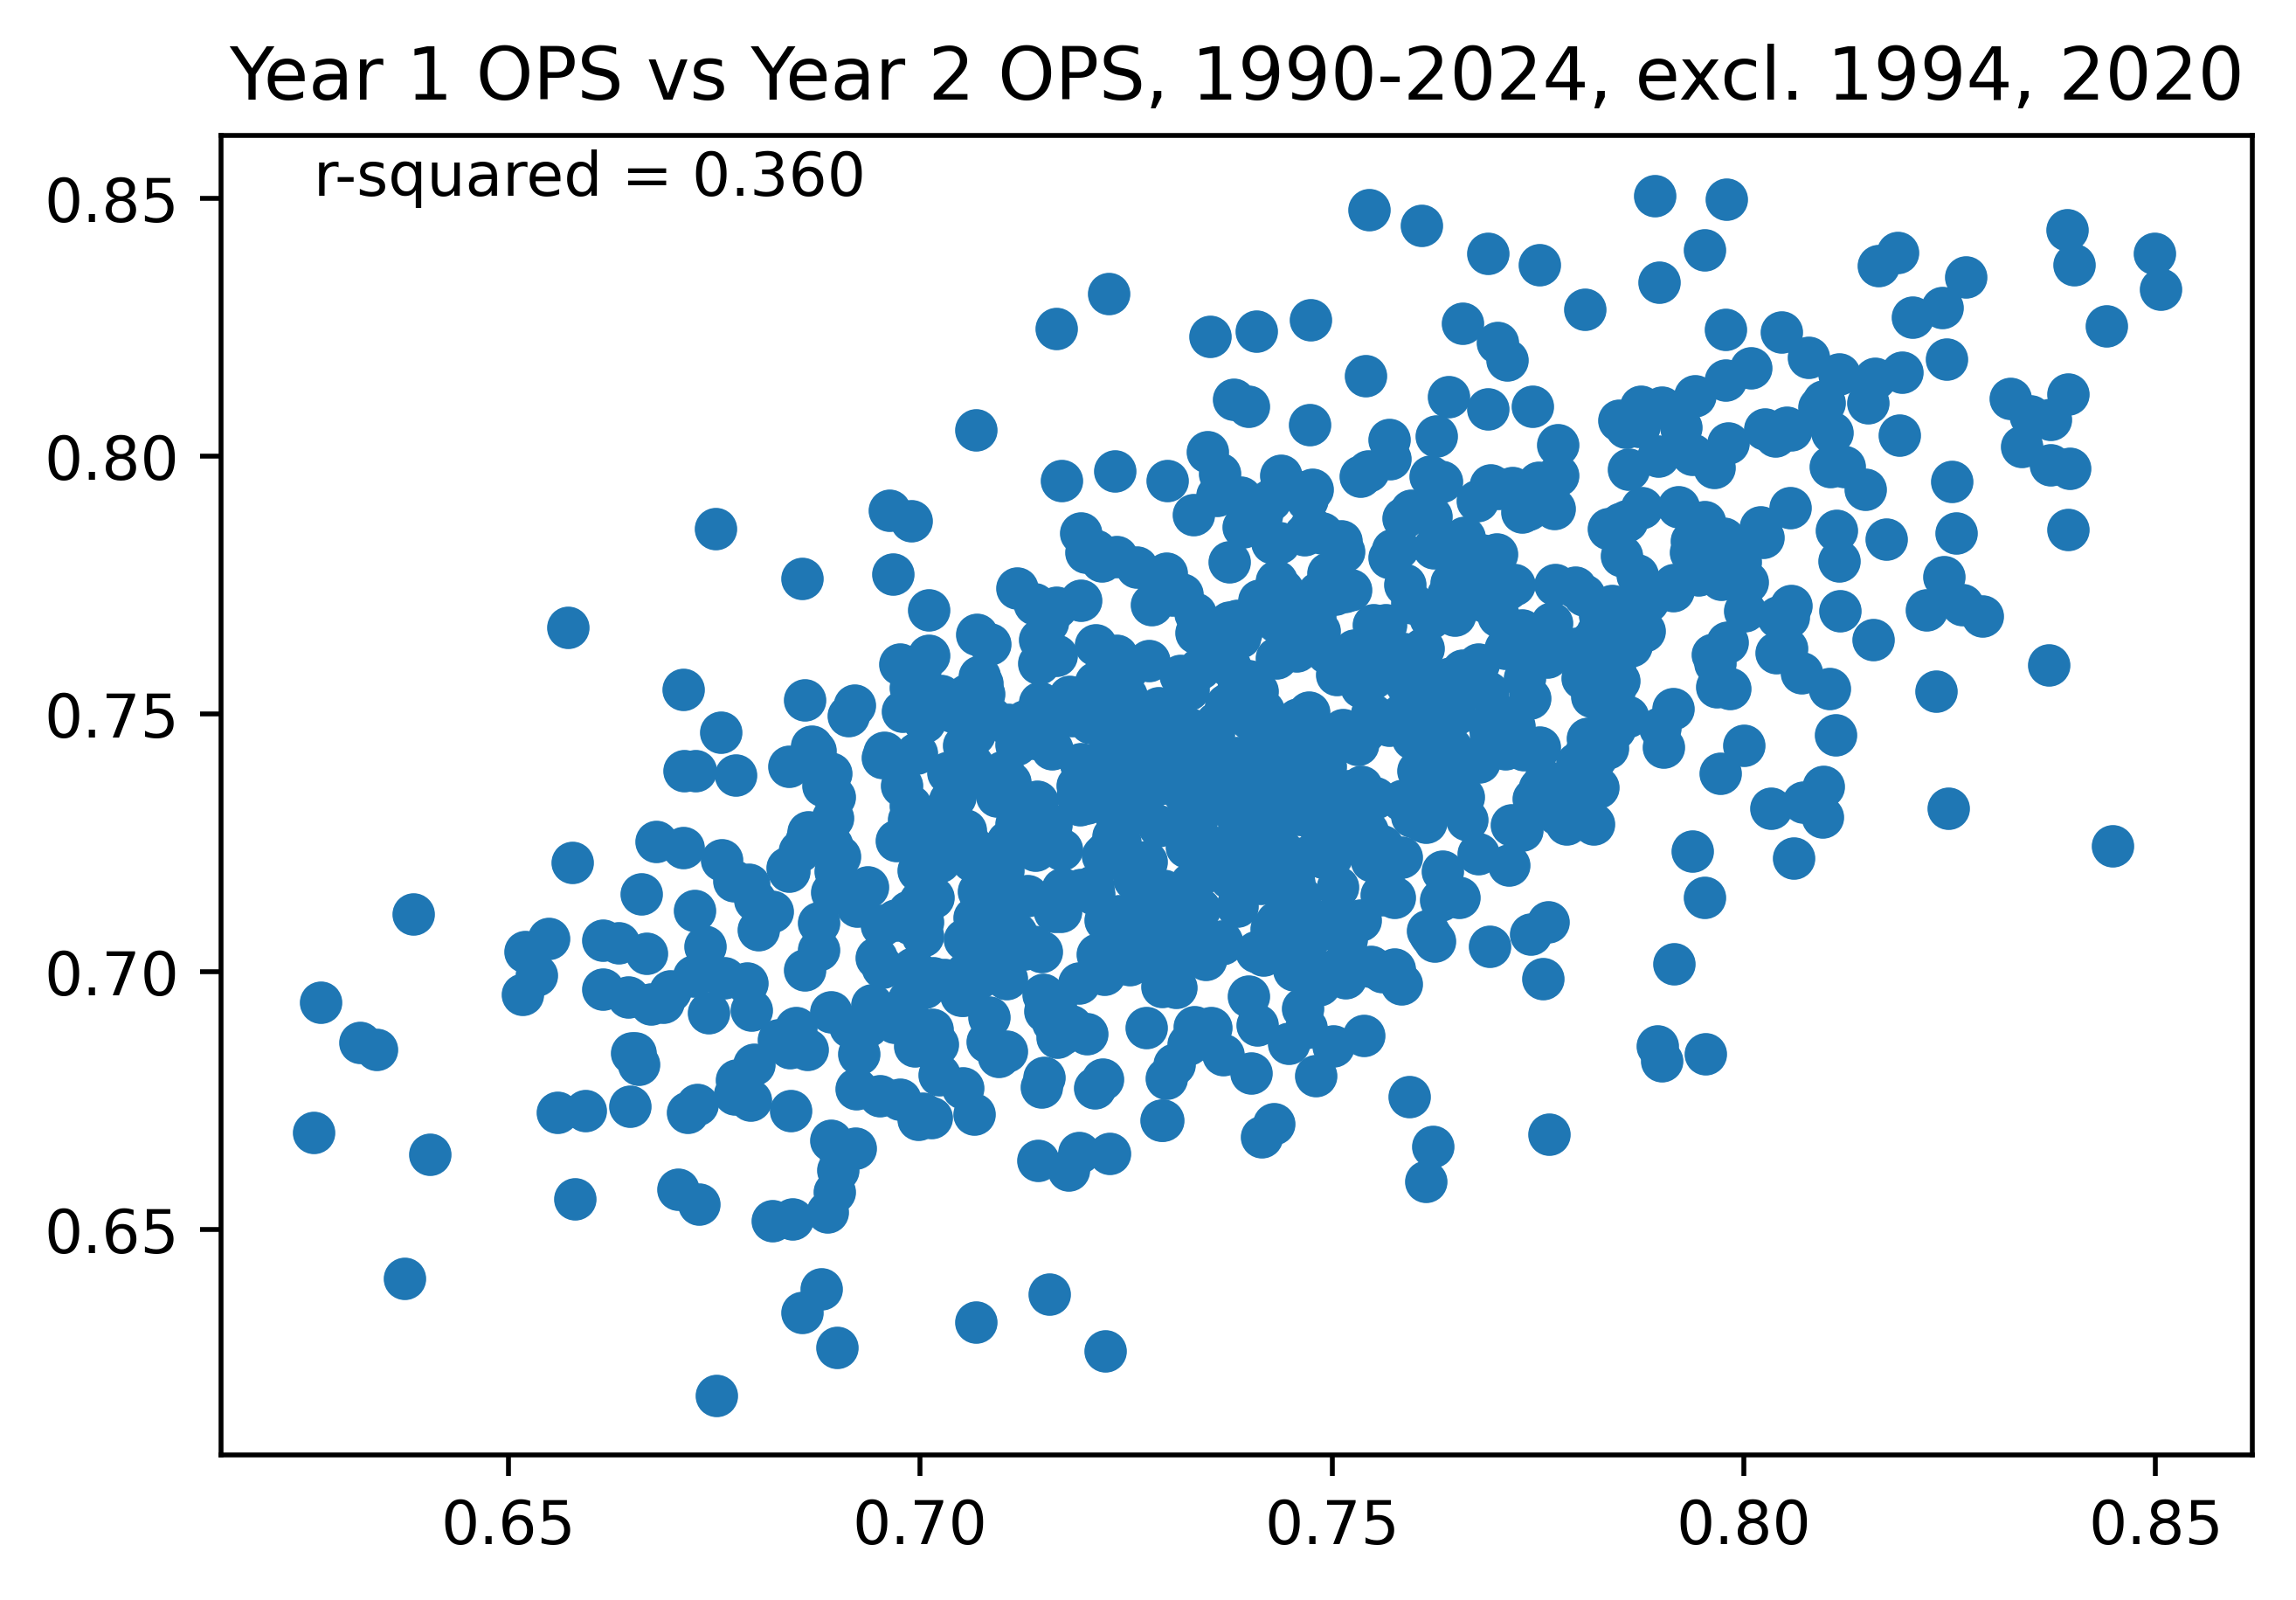 Figure 4. Predictiveness of Year 1 Team OPS vs Year 2 Team OPS, 1990-2024, excl. 1994, 2020
 Figure 5. Predictiveness of Year 1 Team wOBA vs Year 2 Team wOBA, 1990-2024, excl. 1994, 2020
Figures 4 and 5 show that wOBA is more predictive of itself than OPS is, implying that wOBA is more correlated with True Talent. If some theoretical stat correlated perfectly with true talent, we would expect that it’s year 1 vs year 2 coefficient of determination would be very high—not 1, because talent changes from year-to-year, but very high, up to some theoretical maximum which simply equals how much talent stays the same from year-to-year. So, this means that you can tell if a stat is more reflective of True Talent than another stat by comparing their correlations to their future values.
Next, we can move onto our percentiles table.
| Percentile | wOBA |
|---|---|
| 10th | 0.297 |
| 20th | 0.309 |
| 30th | 0.318 |
| 40th | 0.327 |
| 50th | 0.335 |
| 60th | 0.344 |
| 70th | 0.352 |
| 80th | 0.364 |
| 90th | 0.382 |
| Table 1. Percentiles of wOBA among qualified players, 2010–2024 |
You’ll notice Table 1 looks very very similar to the OBP table. Naturally the 50th percentile is the same on both charts, and all the percentiles match up almost perfectly. I’m actually not entirely sure why this is. The only thing that’s been adjusted in calculation of wOBA is its mean, not its standard deviation. That is an interesting question for one to explore (and let me know!). The fun thing is, I don’t actually need to go through Fangraphs to let everyone know the actual league average for this stat, because you can just go back to the article on OBP to see what the league average OBP generally is, and that is by definition the same as the league average wOBA!
Finally, we are finished with our foray into the calculation of wOBA. Next week, I’ll be exploring how to calculate the children of wOBA: wRAA and its more popular, and attractive sibling, wRC+.
These articles are getting very long. I truly apologize, but there’s just so much to say.