The next stat to explore is On-Base Plus Slugging (OPS), an extension of OBP. As the name suggests, it is simply the sum of two stats: on-base percentage and slugging percentage (SLG), the latter of which we haven’t encountered yet. Slugging percentage measures the number of total bases (TB) per AB a batter gets. A total base is the number of bases from hits by a batter; 1 for a single, 2 for a double, etc. It does not give any credit for walks, hit by pitches, or baserunning like stolen bases. To illustrate this stat, I’ll provide an example. If a player, in their first PA of a game, hits a triple, they now has a 3.000 SLG for the game (3 TB divided by 1 AB). If, in their second PA, they hits a single, their SLG is now 2.000. If, in the third PA, they walks, their SLG remains 2.000 because a walk doesn’t count as an at bat. Table 1 is a percentile chart of all qualified players for SLG from 2010 to 2024.
| Percentile | SLG |
|---|---|
| 10th | 0.368 |
| 20th | 0.391 |
| 30th | 0.409 |
| 40th | 0.424 |
| 50th | 0.440 |
| 60th | 0.457 |
| 70th | 0.475 |
| 80th | 0.499 |
| 90th | 0.534 |
| Table 1. Percentiles of SLG among qualified hitters, 2010–2024 |
Once again, this is caveated with the fact that a player with a .440 SLG isn’t producing league-average SLG, but instead is an average qualified player. The true league average in this time period ranges between .386 and .435 (2019… juiced ball year), with the true average being about .405. It’s interesting to note that SLG has much higher variance than OBP. This is likely due to the wider scale of OBP, ranging from 0 to 4 rather than just 0 to 1.
Next, these two stats are combined to form OPS. A player with a .325 OBP and a .450 SLG will have a .775 OPS. OPS is incredibly simple to calculate once you know these two numbers because all it asks you to do is add them together. This is one of its many merits.
| Percentile | OPS |
|---|---|
| 10th | 0.678 |
| 20th | 0.709 |
| 30th | 0.732 |
| 40th | 0.753 |
| 50th | 0.776 |
| 60th | 0.797 |
| 70th | 0.821 |
| 80th | 0.853 |
| 90th | 0.900 |
| Table 2. Percentiles of OPS among qualified hitters, 2010–2024 |
I know I sound like a broken record but, once again, these values in Table 2 are inflated. The actual league average OPS ranges somewhere between .700 and .758, with its value most recently being .711 on average in the year 2024. Frankly, the reason I don’t care too much about the values in these tables being inflated is because I think the most valuable thing you can gauge from this data is firstly the approximate good and bad lines, and secondly the variance in the statistic (is every player almost the same? Do players sometimes vary by hundreds of points?). You shouldn’t necessarily use these tables as gospel when evaluating players. I’ll introduce some stats later on that can serve the same purpose as these tables but are much more intuitive and easy to use.
So, now you have an idea of what it is and how to evaluate it, but how good is OPS at its job, predicting run production? Pretty good, actually. Figure 2 below shows how a team’s OPS correlates with their runs scored per team game played.
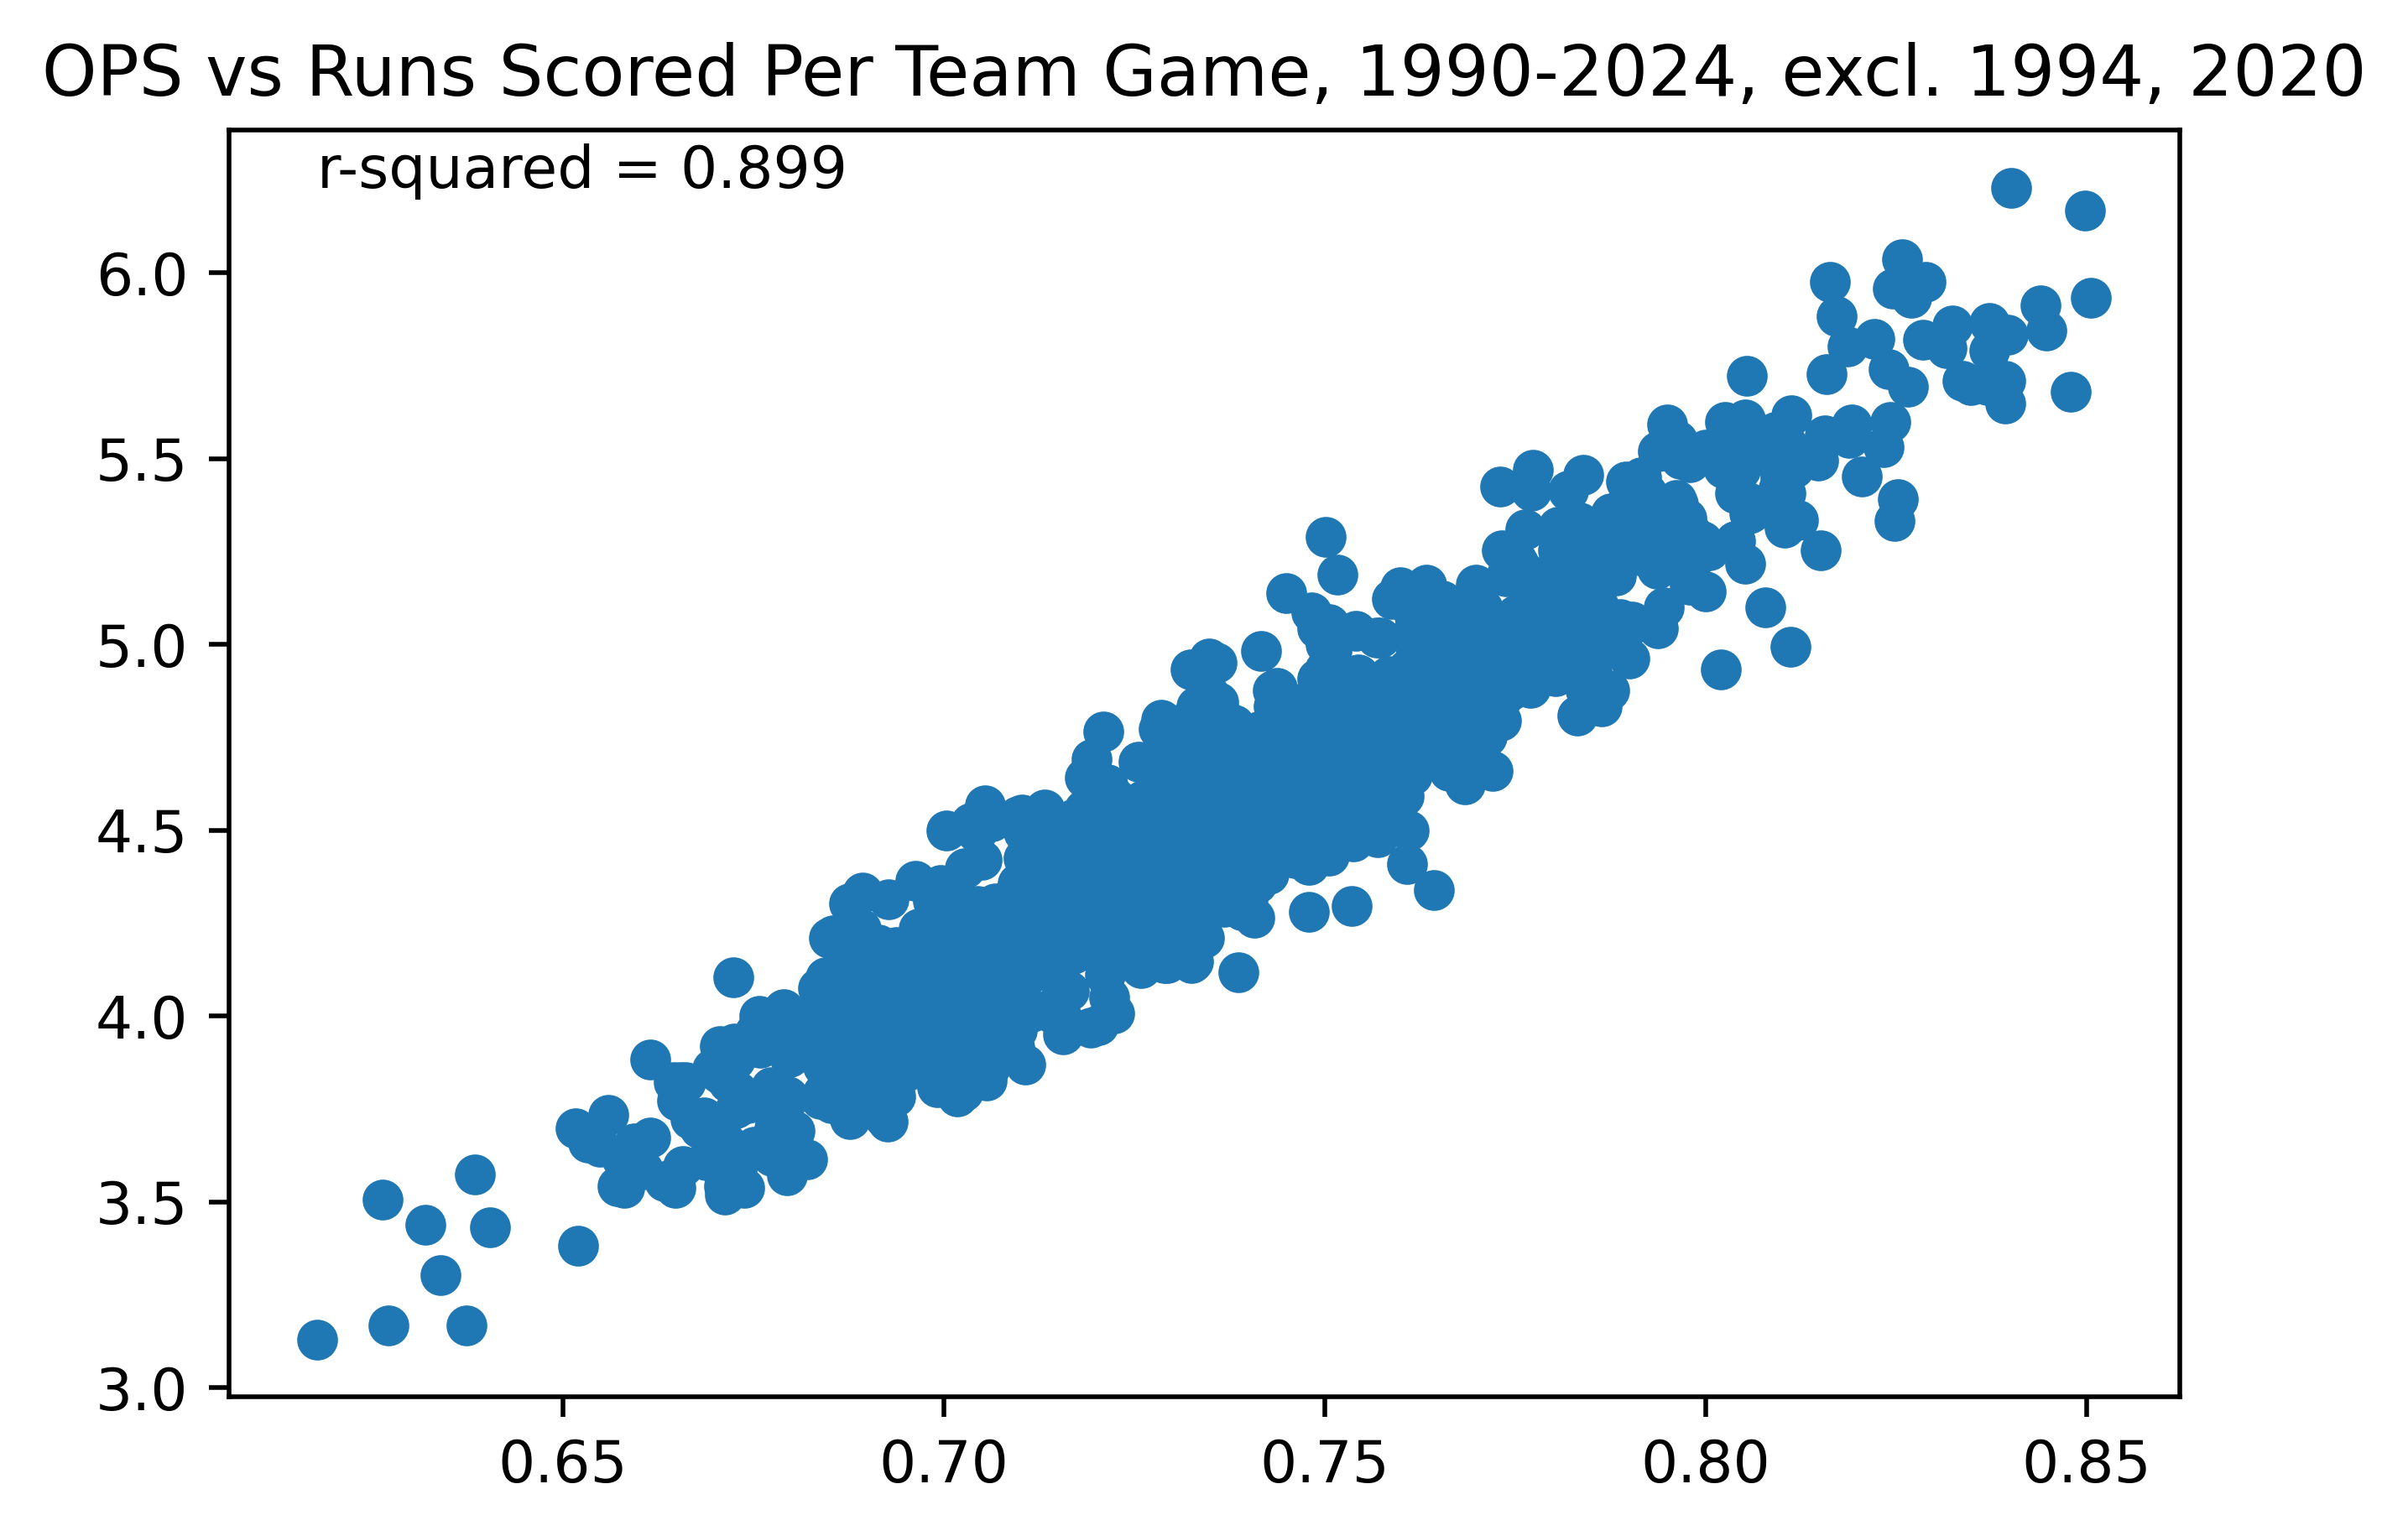 Figure 1. Team OPS vs Runs Scored, 1990-2024, excl. 1994, 2020
As you’ll recall from my article on OBP, OBP has an R-squared of 0.704 against runs scored. OPS, in Figure 1, has an R-squared of 0.899. Even visually you can recognize how closely OPS corresponds with run scoring. OPS is incredibly good at predicting the number of runs a team will score over a season because it encompasses and accounts for all outcomes.
However, and I swear this will be the last rug pull of the basic batting stats section of this series, OPS is still not as good as we can get. The astute (or analytical) among you will notice that this number is incredibly arbitrary. It corresponds well with run scoring which is great, but there is no clear reason why nor is there any correspondence between the value of OPS and the number of runs a team would be expected to score. Of course we can run a regression between OPS and runs scored, but this relies on happenstance that OPS and runs scored linearly correlate (and it will become especially relevant in the 201 Advanced Value Stats section of this series later on). It does work, and if you really wanted to, you could stop here, never go to any stat more advanced than OPS, and be happy. Honestly, for most people, it will do a perfectly good job. Next week will be the start of a two-parter mini-series of articles which will culminate in the wOBA stat.