Note: Sorry about this article taking extra long, my exams got more busy in the last week and this article has quite a bit of content, so it took 2 weeks between articles instead of 1.
Believe it or not, we’re actually nearly at the end of the series on basic hitting stats. wOBA is really the part that brings it all together. If you look at a Fangraphs page you should understand almost all of the stats on their default dashboard! There’s a few I’ve missed out because I don’t think they need dedicated articles (if I explore them in more depth, that’ll be for analysis), so I’ll list a few right now and go quickfire, before getting into the main article.
- BB% — The percentage of PAs that end in a walk, calculated using the formula
- K% — Same thing, but for strikeouts
- BB/K — What it looks like, the ratio of walks to strikeouts
- ISO — Isolated Power, a measure of hitter power, calculated by . The league average (NOT for qualified players, just overall) is about .140, a great player will have .200, elite will be .250, and a poor player will be about .100 (these numbers are from the Fangraphs Sabermetrics Library page on ISO)
Anyways, time for the main article on weighted runs, specifically wRAA and wRC+. wRAA is a bit neglected by fans, so let’s start with it to make it feel a bit more loved (it’s also pre-requisite to learning about wRC+).
Weighted Runs Above Average
wRAA (Weighted Runs Above Average) is simply a way of achieving our overall goal: taking basic hitting stats and approximating run scoring. Thus far, we’ve come up with stats and compared them to team run scoring, but what if we wanted to approximate the impact which an individual hitter has on his team? That is where Weighted Runs come into play. I’m not sure if “Weighted Runs” is an actual term on its own, but I like it, so I’ll use it. Essentially, it involves using linear weights in some way (using wOBA, generally) to figure out the number of runs a hitter is worth.
For wRAA, we’re looking for the runs above average, so we can start with that. We can assume that, in some way, . That little fish means “proportional to”—if then where k is some constant. We need to figure out the actual constant of proportionality here. It’s actually quite simple. You’ll recall, in our calculation of wOBA, that we multiplied wOBA by a constant, wOBAscale, to bring its scale in line with OBP. That means that, in order to get closer to finding wRAA, we need to divide the difference between a player’s wOBA and the league average wOBA by this wOBAscale.
As an observant reader (or writer—maybe I am the only one with this thought), you may be asking “but what about when you subtracted the negative value of an out from all the linear weights, why don’t you have to adjust that back?“. If you were to simply divide wOBA by wOBAscale, that would actually still give you a value which has meaning. The issue is, since it’s relative to the value of an out, it isn’t useful for much. It is much more useful to compare it relative to league average.
Dividing this difference by wOBAscale gives us runs above average per PA (since wOBA is defined per PA), so now you simply need to multiply by the number of plate appearances a player has to get their total wRAA.
wRAA Formula
Analyzing wRAA
We can do a similar analysis with wRAA and runs scored. This time, since wRAA is a cumulative stat, it will not be on a per-game basis.
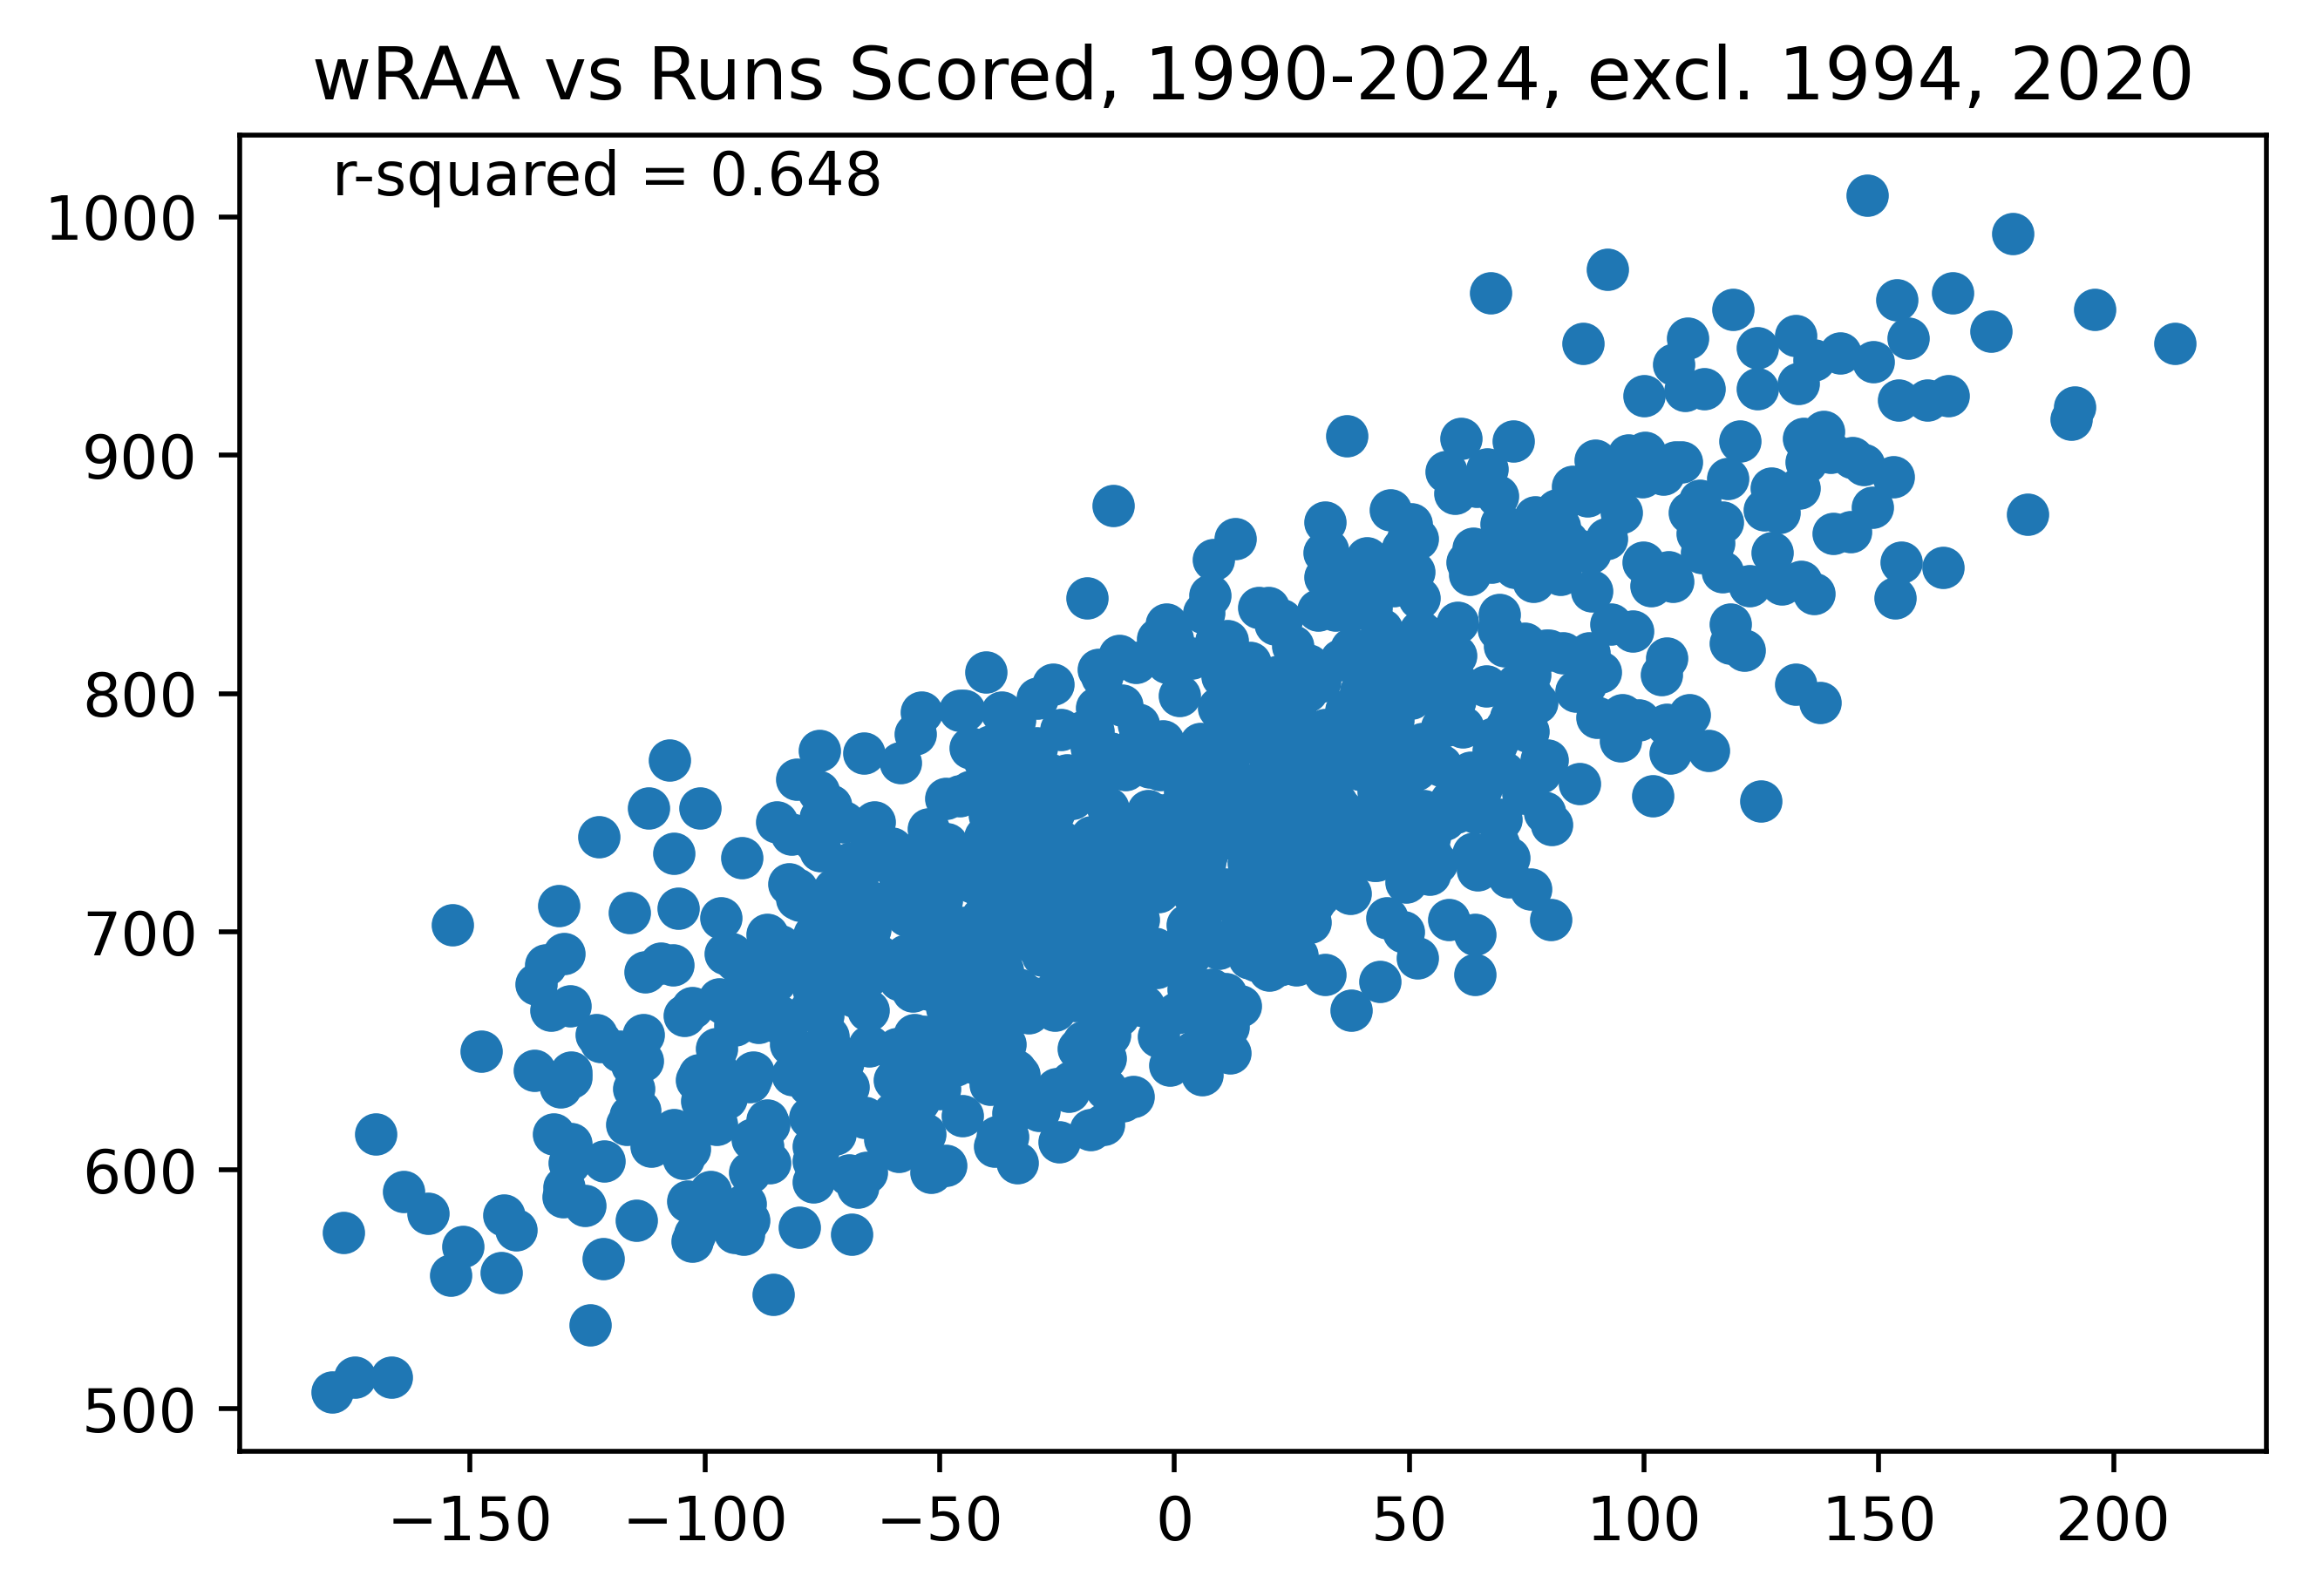 Figure 1. wRAA vs Runs Scored, 1990-2024, excl. 1994, 2020
Wait a minute, why is it so bad? Compared to almost any stat we’ve looked at (other than batting average—and it straddles exactly halfway between batting average and OBP) it is quite poor. It’s because we’ve forgotten something: average changes. The average runs per game in the league in this time period has varied from 5.14 runs per game (in 2000) to as low as 4.12 runs per game (in 1992). That is a massive difference, which leads to a large amount of variation not accounted for. So while wRAA is cool for comparing a player to league average, we need something else if we want to use it to approximate run scoring.
- insert run scoring percentile table?
Weighted Runs Created (wRC)
wRC is quite simple. Essentially, you are trying to take wRAA and adjust it so 0 is zero value, not average. The way to do this is actually very self explanatory.
wRC Formula
You simply take wRAA, and then add the number of runs that are scored by the league on average in that number of PAs! You’ll see this a lot, especially later on. If you have an average stat and add the league average value you get a stat with zero being zero value. Or if have a stat where zero is zero value and subtract league average value, you now have a stat centered around league average. For an example player, let’s use my favorite Cub from this year, PCA. He has 10.1 wRAA in 193 PA. This year, lgR/PA is 0.116, giving PCA a wRC of 32.49, pretty much matching his 33 wRC (note, only accurate to the ones place) according to Fangraphs (likely, his wRAA or the value for lgR/PA is slightly rounded down).
Analyzing wRC
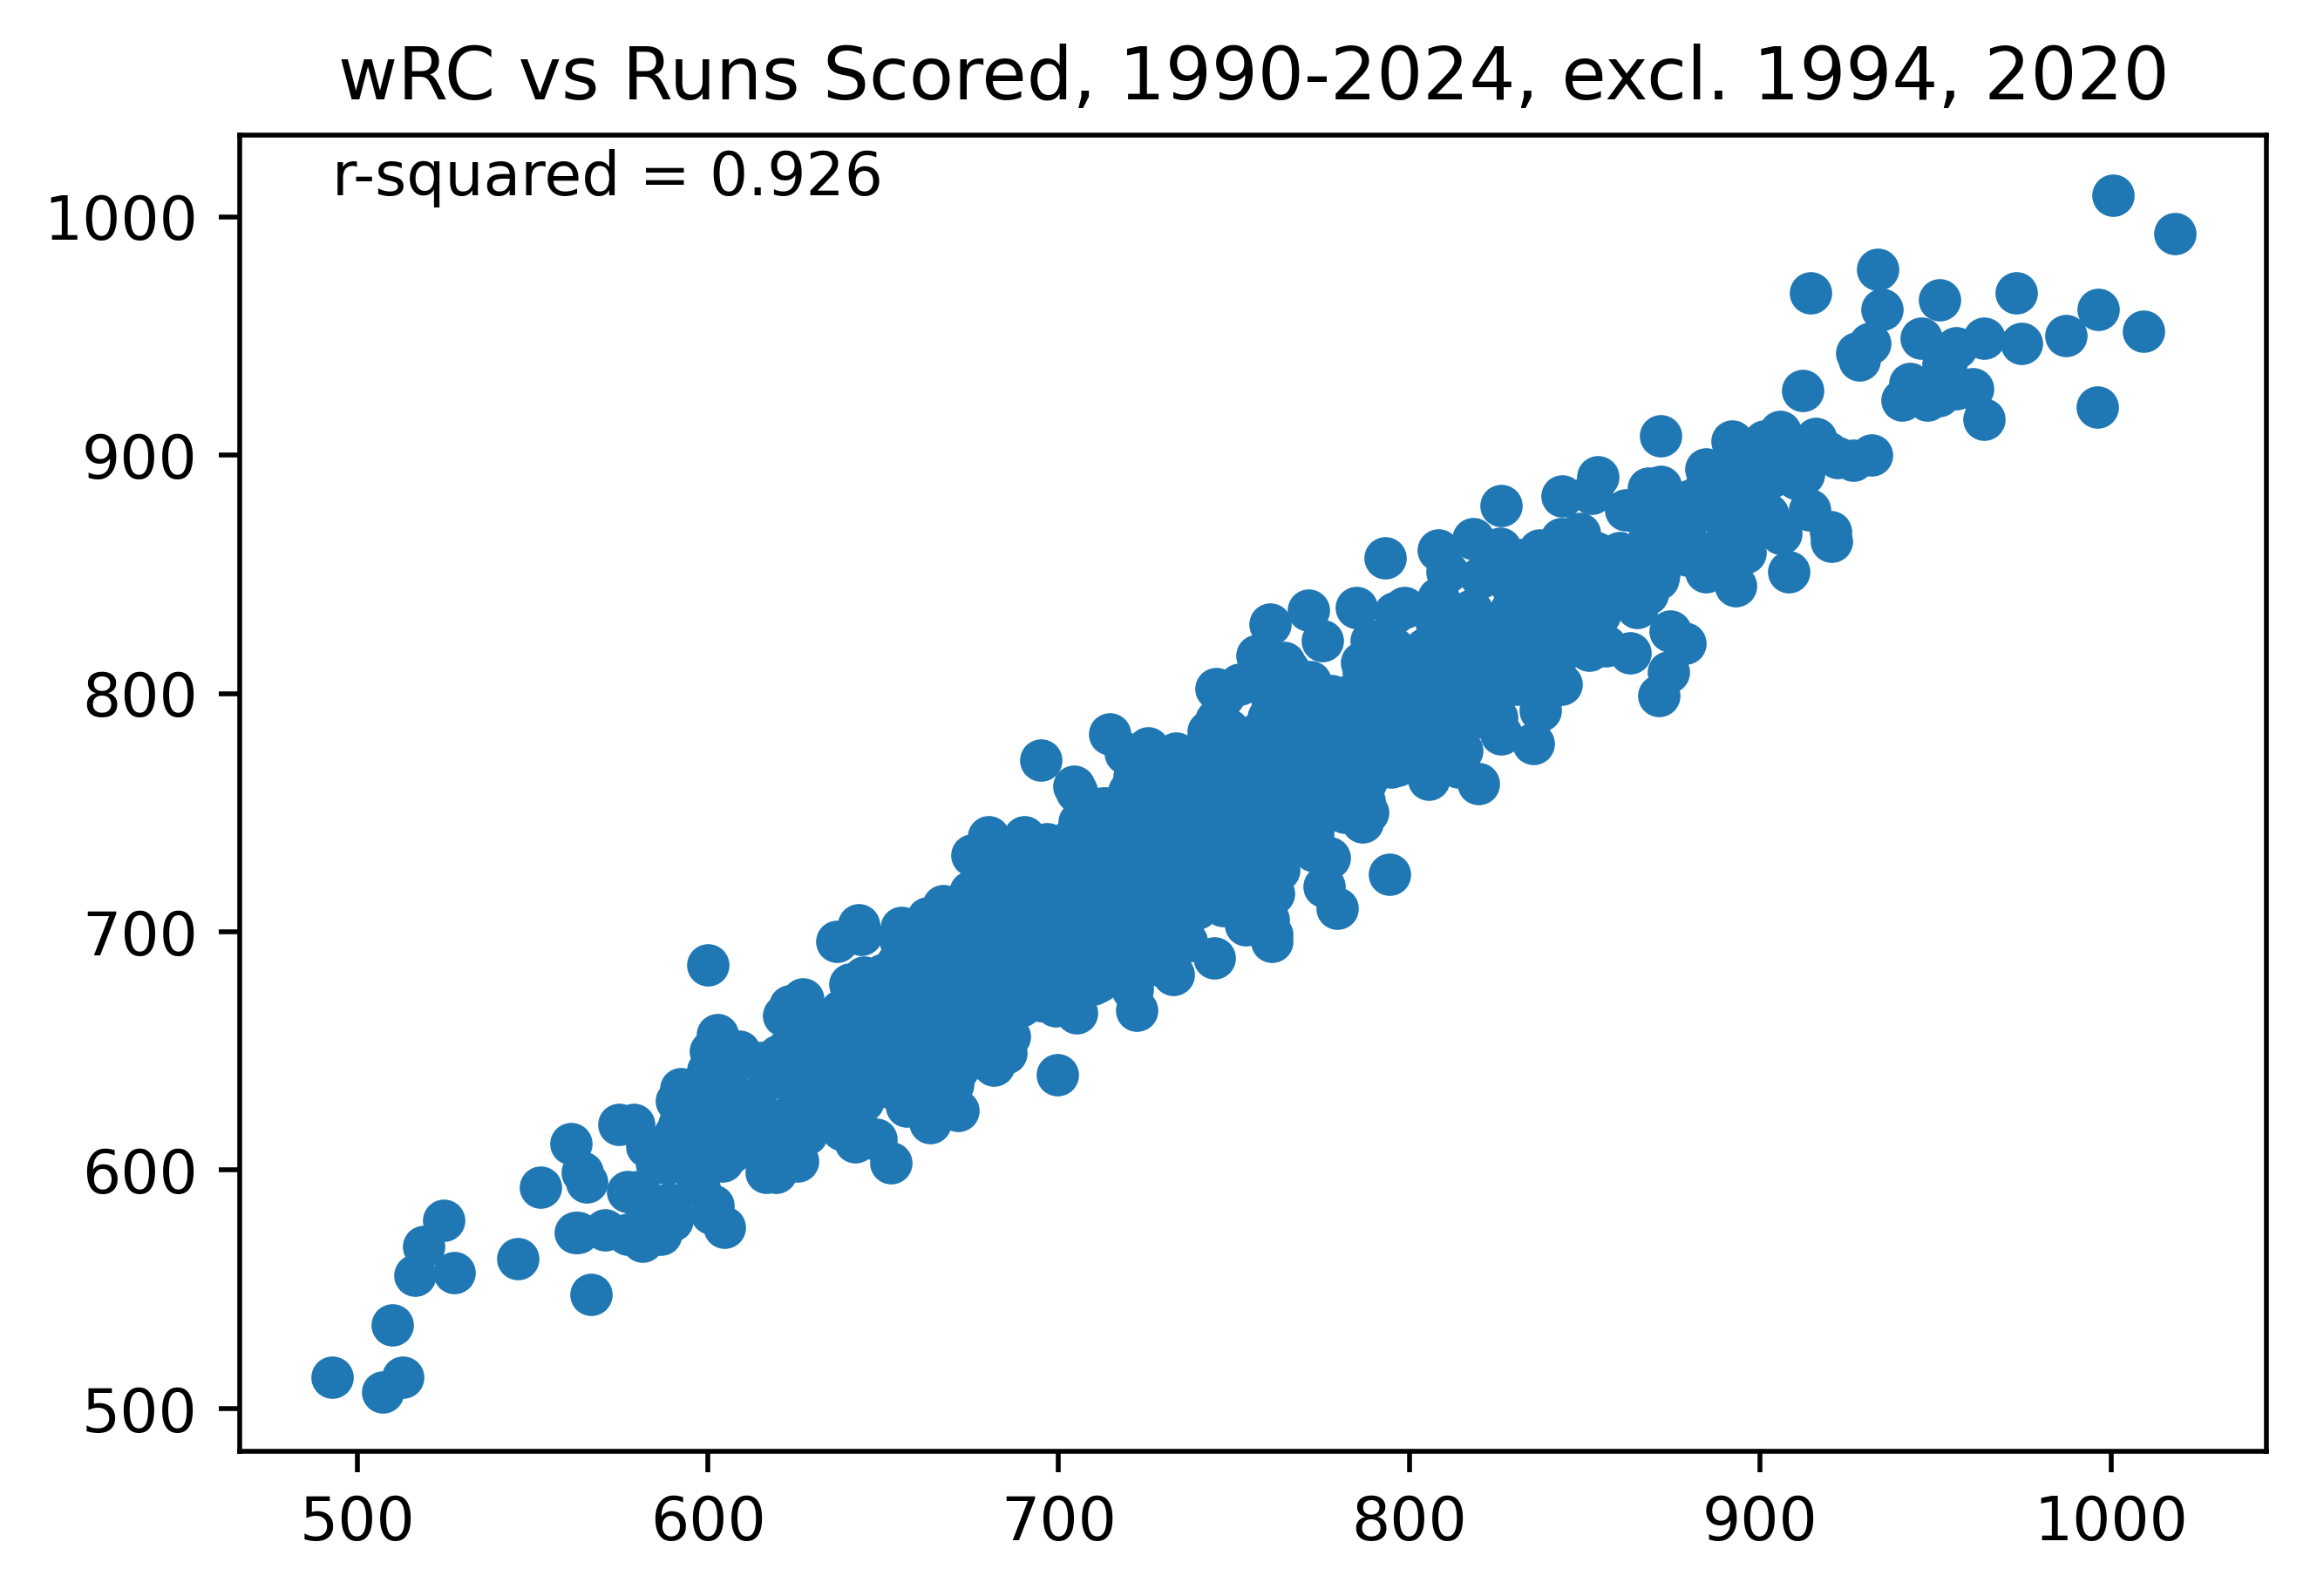 Figure 2. wRC vs Runs Scored, 1990-2024, excl. 1994, 2020
I think we’ve found our holy grail. If your goal is to create a stat which correlates with run scoring, wRC almost perfectly fulfills this goal. This is the best we’ve seen so far. And I want to appreciate for a second how amazing this is. Using nothing but the number of singles, doubles, triples, home runs, walks, and hit by pitches a team has, you can account for 92.6% in the variation of run scoring. That might sound like a lot of information, but there is no information about the sequencing of hits, there is no information about stolen bases or any baserunning, and there is no information about sacrifice hits. Without all of this information, you can still account almost perfectly for run scoring. That’s partially because stuff like hit sequencing isn’t so important. If you get a home run then a single, that’s just bad luck, and, in the long run, every team will get the same proportions of “home run followed by single” and “single followed by home run”—that is to say, if one team gets the former outcome 60% of the time, every other team will probably also get it 60% of the time. This is the power of averages in large enough sample sizes.
I do think one thing that’s important to touch on (that I did briefly reference in my article on wOBA) is that this is not necessarily the best metric for a statistic. It’s cool that we can create things that correlate with team run scoring, but that’s not necessarily the most important thing. The goal of these statistics, primarily, is to isolate an individual hitter’s impact from the rest of their team, so you can figure out exactly how many runs an individual hitter is worth. By consequence, they make compromises in terms of being truly reflective of a team’s offensive ability—for example, not giving offensive credit for good lineup construction, or driving runners in on sacrifices, or a bunch of other things that an individual hitter hardly contributes to but still definitely exists.
Adjusted Weighted Runs Created (wRC+)
Intro
This is the statistic that, if you’d seen just one of the stats in this article coming into it, you’d know. Essentially, wRC+ is wRC, but adjusted. It is adjusted for two things;
- Park factors, so players who hit in hitter-friendly parks receive a lower wRC+ than players who hit in pitcher-friendly parks with an equivalent wRC
- League quality. wRC+ is set so 100 is exactly league average, and every point above or below 100 is one percentage point more or fewer runs created. So, a hitter with a 125 wRC+ has produced 25% more runs than the league average player. Before I get into the wRC+ formula, what exactly are park factors?
Park Factors
Essentially, the premise behind park factor is that different parks are better or worse for offense. This makes sense, right? Colorado is a hitter’s park, Seattle is a pitcher’s park. This can be caused by anything from dimensions, elevation, temperature, wind, humidity, or even something as trivial as the color or placement of the batter’s eye in CF. But, beyond what causes parks to be better or worse for hitters or pitchers, the goal is to quantify exactly how much of a hitter’s park or pitcher’s park a place is. This is not exactly easy.
Your first instinct might be to simply take the run production at that park and divide it by the league average run production, but then you run into an issue where, if the team that plays all their home games at that park is better or worse than average, that will be attributed to the park.
The exact solution varies slightly depending on who is calculating it, but generally what is done is by comparing a team’s offensive production at their home park not to the league, but to their offensive production (in runs per game) when on the road. And this is not done over one year, but instead 2, 3, or often 5 years, to reduce variance and noise in the data. It is then generally regressed towards the mean somewhat to further reduce variance. You can read more about Fangraphs’ method here (though I’m not sure if this is the method they still use, given I think this article may be from the early 2000s given the references to the San Juan Expos).
But, essentially, park factors, at least on Fangraphs, are a number where 100 is a neutral park. But, instead of each point being 1% above average in run scoring, it is 2%. Why? Because the park factors are divided by 2 to account for only 81 games being played at home. If 10% more runs are scored in a park, the park factor will be 105, not 110. This is an imperfect approximation (not every player plays 50% of their games at home, and not every team has exactly average park factors in their away games) but it’s close enough.
Calculating wRC+
wRC+ Formula
That formula takes a player’s wRC per PA, adds something which adjusts for the park factor, and then divides by the league wRC per PA, and finally multiplies by 100. The factor for park factors, just adjusts it so, if a player plays in a stadium with a park factor of 100, nothing is added to their wRC/PA, if a player plays in a stadium with a park factor over 100, an amount is subtracted from their wRC/PA, and the converse for a park factor below 100. It just adjusts a player’s production per PA downwards or upwards depending on the park they play in. Finally, this adjusted production for the player in the numerator is divided by the league average wRC/PA (technically, this average excludes pitchers in the calculation, though that effect is negligible in the post-universal DH era) and multiplied by 100 so 100 is average, rather than 1. A player who produces 0.2 wRC/PA in a park with a park factor of 110 (20% above average in half their games) will have an adjusted wRC/PA of 0.1884 (, where lgR/PA = 0.116) and thus a wRC+ of . Simple!
Analyzing wRC+
I think that the interesting thing here would just be to look at the percentiles of wRC+ amongst qualified players, so here they are.
| Percentile | wRC+ |
|---|---|
| 10th | 84 |
| 20th | 93 |
| 30th | 100 |
| 40th | 105 |
| 50th | 111 |
| 60th | 117 |
| 70th | 123 |
| 80th | 131 |
| 90th | 141 |
| Table 1. Percentiles of wRC+ among qualified players, 2010–2024 |
The first interesting thing here is that this gives us our first opportunity to quantify just how much better than league average the median qualified player is: about 10 percent! And this should just give you an idea of what is good and what is bad. But also, in general, wRC+ is very easy to interpret because the more above 100 the more good you are, and the more below 100 the more bad you are.
This is likely the final article in the 101 Basic Hitting Stats section of this Sabermetrics tutorial series, though I’ll be publishing an additional article (an addendum of sorts) next week where I talk about some of the math behind OPS+ and wRC+. It’s just something I’ve already written that I’m polishing for this blog. Optional to read if you just want to get information as efficiently as possible, but, in my opinion, very interesting. Then, I’ll get started on talking about 102 Basic Pitching Stats (which may or may not take yet another week off)!